Bitcoin buy signal emerges as Hash Ribbons indicator shows miner stress: CryptoQuant
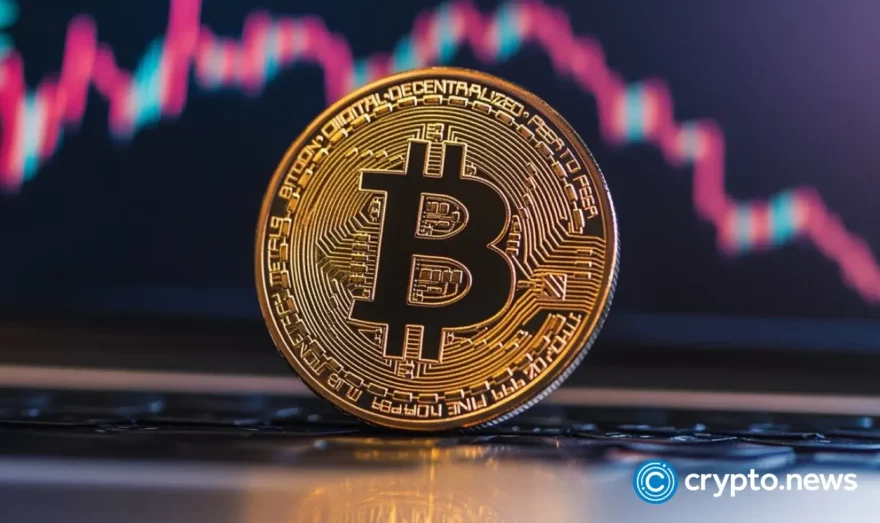
A fresh Hash Ribbons buy signal has flashed for Bitcoin, a historically reliable indicator that miner capitulation may pave the way for a bullish reversal.The signal, highlighted in a June 5 analysis by CryptoQuant contributor Darkfost, shows a crossover in Bitcoin’s (BTC) 30-day and 60-day hashrate moving averages. This pattern has historically preceded major price recoveries and is often triggered when weaker miners capitulate during periods of unprofitability.“Mining becomes unprofitable for certain miners, and they are forced to sell BTC in order to stay operational,” Darkfost explained. This may lead to short-term selling pressure, but it often prepares the market for longer-term rallies as network stress decreases and supply begins to tighten. The renewed Hash Ribbons signal comes shortly after Bitcoin’s hashrate hit new all-time highs, indicating both intense miner competition and increasing energy costs. With the notable exception of the 2021 China mining ban, Darkfost notes that this dynamic has previously aligned with strong accumulation zones.New on-chain data from another CryptoQuant contributor Amr Taha adds to the bullish sentiment. According to Taha, long-term holders have started to accumulate again, and their net realized cap now exceeds $20 billion. Such actions by LTHs, entities that hold Bitcoin for longer than 155 days, have historically come before significant bullish periods.BTC Bullish Momentum: Binance Spot Volume Increases, LTHs Show Strength, & Outflows Indicate Growth“The convergence of rising exchange dominance, LTH confidence, and supply tightening paints a bullish picture for Bitcoin.” – By Amr TahLink ⤵️https://t.co/GZUr9bObsI pic.twitter.com/CNq0Jj79CbIn addition, centralized exchange activity reveals a tightening supply environment. Recently, more than 20,000 Bitcoin were withdrawn from Bitfinex and Kraken in two days, and Binance grew its market share in spot trading from 26% to 35% in early June. Both of these indicate growing investor confidence and demand.Bitcoin is trading at $104,952 at press time, down 0.4% over the past 24 hours and 6.6% below its all-time high of $111,814 set on May 22. Price remains within a 7-day range of $103,414 to $108,776.The MACD and momentum indicators point to mild bearishness, while the RSI is at a neutral 51.68. Although the price action is above longer-term support levels, it is below important short-term moving averages, such as the 20-day simple moving average at $106,752. A possible short-term rebound is suggested by the Stochastic RSI, which is in oversold territory.Bitcoin may retest the all-time high at $111,814 if it can recover the 20-day SMA at about $106,752 and rise above the $108,000 level. If short-term holders start to capitulate, failing to hold above $103,000 could pave the way for a decline toward $100,000 or less.Without a clear bounce in demand, any further miner stress could lead to forced sell pressure, which would push prices below the current consolidation zone. Although short-term indicators are warning of caution, the macro trend for Bitcoin is still bullish overall. The next leg up will probably be determined by a clear move above the $106,000–$108,000 resistance zone.

Published on Other News Site
Recommended
Maple Finance expands to Solana, deploys yield-bearing stablecoin
06 June, 2025 | 3 readers
Institutional Bitcoin ETF holdings see first quarterly decline �...
06 June, 2025 | 7 readers
Arca exec drops F-bomb on Circle in letter trashing its IPO
06 June, 2025 | 7 readers
WLFI sends cease-and-desist letter over ‘unauthorized’ Trump ...
06 June, 2025 | 8 readers
US wants $7.7M in crypto laundered in North Korea IT worker plot
06 June, 2025 | 2 readers
Trending This Week
Related News

Bitcoin Soars as Gold Dips: The Stellar 12% Surge in BTC/XAU Signals a Market Shift
7 November, 2024| 111 readers
Protocol Village: Nexus Launches 'World's First Open Prover Network' in Beta
10 October, 2024| 105 readers
Crypto Wallet Holding $2B Mt. Gox Bitcoin Sends Test Transaction as Distribution Continues: Arkham
13 August, 2024| 104 readers
Bhutan, Tiny Country With $3B GDP, Holds Over $780M in Bitcoin
17 September, 2024| 103 readers
Leverage in the Bitcoin Market Is Increasing Again as $58.5K Becomes Key Level
12 September, 2024| 102 readers
An Interview With El Salvador’s Top Crypto Regulator: ‘Developing Countries Can Lead the Financial Revolution’
16 November, 2024| 98 readers
Strategic Bitcoin Reserve Has Precedent in Other Big U.S. Government Purchases: Michael Saylor
14 November, 2024| 97 readers
Protocol Village: Worldcoin, Sam Altman-Backed Crypto Project Known for Iris-Scanning Orbs, Turns to '1:1 Face Comparison'
19 September, 2024| 97 readersRelated Peoples