Bitcoin upside could stop at $100K despite $3B in ETF inflows

Key points:
High Bitcoin ETF inflows don’t always signal a price top as historical data is mixed.
Spot Bitcoin inflows often precede short-term price rises, not reversals.
Bitcoin may hit $100K but faces resistance.
Bitcoin’s (BTC) price recovery may be stalled at $100,000 as questions emerge whether high ETF inflows have always marked the local top for the asset.
Does $1B Bitcoin ETF inflows signal a top?
Bitcoin has displayed bullish momentum after recovering from its multimonth lows of $74,400. BTC is up 8% over the last seven days, as per data fromCointelegraph Markets ProandTradingView.
Bitcoin’s recovery was fueled by high investor appetite for spot ETFs, whichrecorded $3.06 billion net weekly inflows, the largest since December 2025.
Evidence of whether the high spot Bitcoin ETFs inflows could signal that the price is getting close to a local top could be determined by analyzing historical data.
While there have been instances where significant inflows coincided with or preceded Bitcoin price peaks, this has not always been the case.
The chart above shows that in March 2024, spot Bitcoin ETFs saw record inflows of over $1 billion on March 12, with BlackRock’s IBIT alone receiving $849 million.
This preceded Bitcoin’s new all-time high of around $73,300, suggesting a potential top signal. Similarly, on June 3, 2024, daily inflows hit $917 billion, aligning with Bitcoin’s rally from $67,000 to $72,000, followed by a 25% correction to $53,000. These cases support the idea of major inflows preceding local tops.
However, in November 2024, weekly inflows hit $3.38 billion, as Bitcoin hit one all-time high after another, but this did not immediately lead to a price top. Instead, BTC showed resiliencecrossing the $100,000 market for the first timeto its previousall-time highs of $108,000reached on Dec. 17, 2025.
Using a Vector Autoregression model, market analytics resource FalconXdemonstratedthe relationship between ETF net flows and Bitcoin price, and found that inflows have short-term predictive power for price increases, not necessarily reversals.
Related:A ‘local top’ and $88K retest? 5 things to know in Bitcoin this week
How high can Bitcoin price go?
Bitcoin’s 27% rally from the $74,400 range low saw it flip key levels into support, including the 50-day ($85,100), 100-day ($90,570), and 200-day ($89,300) simple moving averages (SMA).
Bitcoin was still consolidating under the resistance at $95,000 as observed by popular analyst AlphaBTC.
“The pink box [at the $95,000 level] has held $BTC’s price for the last few days, as expected,” AlphaBTCsaidin an April 28 post on X, hoping to see BTC move past it as the week opens.
Cointelegraph earlier reported that the $95,000 level marks thenext significant resistancefor Bitcoin and thatcontinued ETF demandand other bullish factors would be key in overcoming it.
AlphaBTC added:
Data from monitoring resourceCoinGlassshows significant seller interest within the $97,000-$100,000 range over the past three months.
This suggests that Bitcoin’s price might rise further to take the liquidity at $100,000 before staging a pullback.
Keith Alan, co-founder of trading resource Material Indicators,doubtedthe ability of BTC/USD to sustain a trip above $95,000. While trading firm QCP Capital argued that Bitcoin lacked a “catalyst” to propel it toward $100,000 for the time being.
This article does not contain investment advice or recommendations. Every investment and trading move involves risk, and readers should conduct their own research when making a decision.

Published on Other News Site
Recommended
15,000 TOKEN2049 Dubai Tickets Sell Out
28 April, 2025 | 5 readers
Nexo to Return to U.S. After 2022 Exit, Citing Renewed Crypto Opt...
28 April, 2025 | 2 readers
Monero Price Surge Likely Attributable to Large Hack: ZachXBT
28 April, 2025 | 4 readers
Bitcoin Turns Positive Year-to-Date as It Veers Toward Digital Go...
28 April, 2025 | 4 readers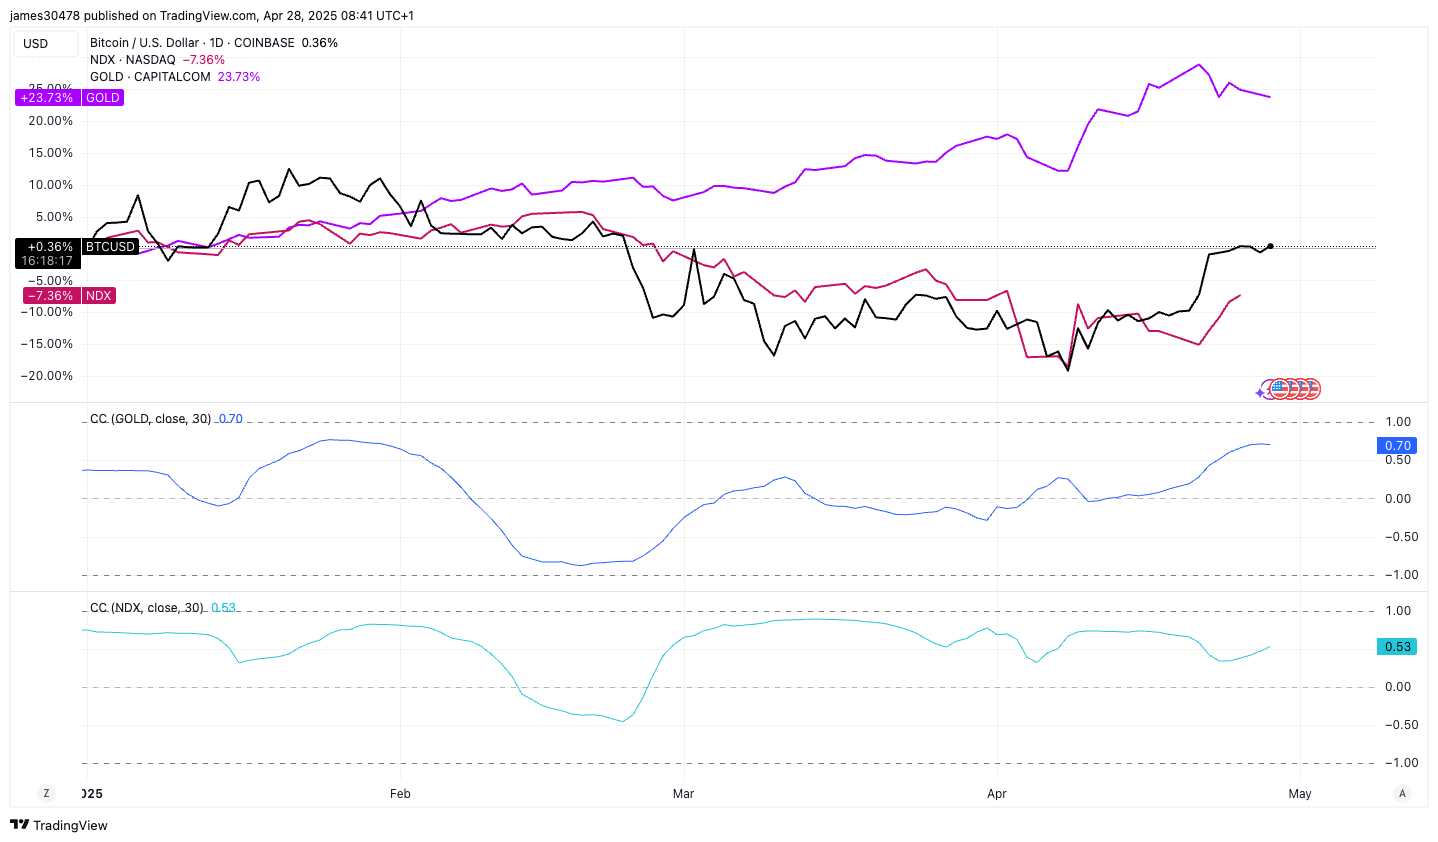
Stacks Asia expands Bitcoin initiatives with Abu Dhabi partnershi...
28 April, 2025 | 4 readers
Trending This Week
Related News
Crypto Wallet Holding $2B Mt. Gox Bitcoin Sends Test Transaction as Distribution Continues: Arkham
13 August, 2024| 75 readers
Protocol Village: Nexus Launches 'World's First Open Prover Network' in Beta
10 October, 2024| 73 readers
Bhutan, Tiny Country With $3B GDP, Holds Over $780M in Bitcoin
17 September, 2024| 73 readers
Bank Clients Just Dipped Their Toes Into Bitcoin ETFs, but Q4 Could See a FOMO Spike
15 November, 2024| 70 readers
Bitcoin Price Rally Hits a Wall at $90K Resistance While FX Traders Back the Dollar Bull Run
13 November, 2024| 70 readers
Bitcoin Soars as Gold Dips: The Stellar 12% Surge in BTC/XAU Signals a Market Shift
7 November, 2024| 69 readers
Leverage in the Bitcoin Market Is Increasing Again as $58.5K Becomes Key Level
12 September, 2024| 68 readers
Bitcoin Keeps Weekly Loss as 'Anti-Risk' Yen Strengthens After BOJ Rate Hike
31 July, 2024| 67 readersRelated Peoples