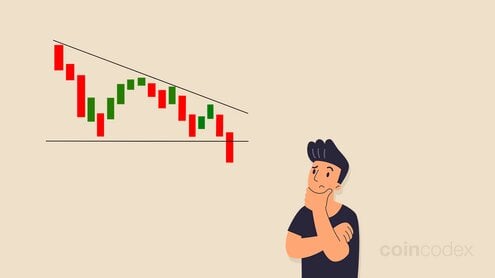
A descending triangle is a candlestick chart pattern that is defined by two trend lines. The upper trend line is descending and serves as resistance, while the lower trend line is horizontal and serves as support.The descending triangle pattern is typically considered bearish, indicating a continuation of a downtrend in the market. However, the descending triangle can also break out to the upside and function as a reversal pattern. Let’s take a look at an example of what a descending triangle candlestick pattern looks like.The descending triangle candlestick pattern is characterized by two trend lines. The upper trendline slopes downwards and is touched by a series of lower highs. Meanwhile, the lower trendline is horizontal and acts as support. In a textbook example of a descending triangle pattern, the descending triangle pattern is resolved when the price cleanly breaks below the lower trend line and the price continues in a clear downtrend. When it comes to trading volume in a typical descending triangle, volume should be gradually declining as the descending triangle progresses, and increase significantly after the price breaks out to the downside.In a descending triangle, the price should touch and bounce from the lower trend line at least twice, and touch the upper trend line at least twice as well. If the price sets a higher high, the descending triangle pattern is considered invalidated.The descending triangle pattern becomes increasingly reliable if the price touches the support and resistance levels defined by the two trend lines multiple times.To sum it up, here are the most important characteristics of a descending triangle pattern:Typically, traders will look for a convincing break below the lower trend line of a descending triangle, and enter a short position on the asset. One of the trickiest aspects of trading a descending triangle is identifying whether a price drop below the lower trend line is a real or false breakout. If there is a significant expansion in volume as the price drops under the trend line, that is an indication of a real breakout. Consider supplementing your chart analysis with tools such as RSI and MACD for additional confirmation of a triangle breakout.The most straightforward way to set a take profit level when shorting the breakout of a descending triangle is to measure the distance between the lower trend line and the first price peak within the descending triangle pattern. A common strategy when trading the descending triangle pattern by shorting its breakout is to set a stop loss at the most recent swing high set within the triangle.Here is a visual representation for better understanding (note that the length of both blue lines is the same).Now, let’s quickly answer some of the most common questions traders have about the descending triangle pattern.The descending triangle is most commonly analyzed as a bearish continuation pattern. In other words, it typically indicates that a downtrend in the market is going to continue.The descending triangle is typically analyzed as a bearish continuation pattern. In some cases, however, a descending triangle pattern can resolve with a break above the upper trend line and a reversal from bearish to bullish market conditions.In a typical descending triangle pattern, trading volume gradually declines as the pattern forms and then expands again once the price drops below the lower trend line.In order to avoid shorting false breakouts from the descending triangle pattern, analyze the trading volume and use indicators such as RSI and MACD to help you determine whether the breakout is real or false.The descending triangle is a fairly simple candlestick chart pattern that provides straightforward take profit and stop loss levels. The most challenging aspect of trading a descending triangle is to develop the ability to differentiate between real breakouts and false breakouts.If you want to learn more about common candlestick chart patterns, we invite you to take a look at the following articles: